ABC analysis for inventory prioritization
ABC analysis sorts stock items by contribution into classes, so counting, ordering and safety stock policies can finally differ where it actually matters.
A spare-parts wholesaler kept three thousand SKUs, and the weekly count sheet ran to three thousand lines. The team counted until dark every Friday, and Monday still opened with calls asking where a part had gone. The problem was not counting discipline. It was that the few hundred items carrying most of the revenue got the same care as two thousand items that moved twice a year.
ABC analysis repairs that imbalance: it ranks stock items by contribution, splits them into classes, and gives each class a different management intensity. Below: which measure to classify on, how to build the analysis, what policy fits each class, how XYZ turns it into a nine-box matrix, and which mistakes quietly ruin the exercise.
What ABC analysis is, and why the Pareto logic holds
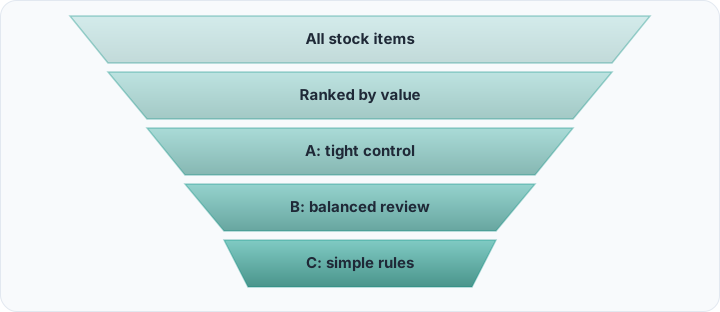
ABC ranks stock items from largest to smallest on one contribution measure, then cuts the list into classes by cumulative share. A few items at the top produce the large majority of cumulative contribution: class A. In the middle sits a band that matters but decides nothing: class B. The rest is a long tail, tiny item by item and enormous in line count: class C.
The intuition is the Pareto principle: most of the outcome comes from a small share of the causes, usually quoted as 80/20. Wherever the split lands in your own data, the curve keeps its shape — a steep head, a softening middle, a long tail. ABC makes that curve actionable.
The real gain is not savings, it is focus. Management attention is scarce: counting hours, supplier meetings, negotiating energy, the best corner of the warehouse. ABC ties its allocation to data instead of habit.
Giving every product the same attention means giving none of them enough; inventory management is a matter of proportion, not equality.
Which measure should you classify on?
This is the most frequently skipped question in ABC, and the honest answer is "it depends on what you are optimizing." The same warehouse produces very different A lists depending on how you rank it.
| Measure | When it is right | What to watch |
|---|---|---|
| Sales revenue | Margins are broadly similar and the focus is top-line volume | Overstates thin-margin, high-volume items |
| Gross profit contribution | Margins differ sharply from item to item | Demands cost data that is current and accurate |
| Movement frequency | The goal is warehouse efficiency and pick time | Pushes cheap consumables further forward than they deserve |
For most businesses the sturdiest setup makes gross profit contribution the primary measure: a high-revenue, thin-margin item does not deserve as much attention as a fat-margin one. Cleaning up cost fields and learning to calculate gross profit margin properly therefore decides the quality of the whole analysis. Movement frequency is operational rather than financial, and it wins for slotting decisions.
Step by step: from data to class
You do not need dedicated software. A transaction export from your accounting module or CRM and a spreadsheet will do.
Pull the data from the right window
Export transactions with product code, quantity sold, sales amount and, where possible, unit cost. The window matters: too short a period turns one large order into a permanent truth, too long a one blurs the product life cycle. Trailing twelve months is a balanced start; where seasonality is strong, one full season cycle is enough. Subtract returns and cancellations.
Rank the list and build the cumulative share
Sort items on your chosen measure and add two columns: each item's share of the total, and the running cumulative share. That cumulative column is the heart of the analysis. Reading from the top, you see where it loses momentum — that bend is your natural cut.
Set the cut points as a business decision
No universal constant defines the boundaries; you do. Class A is the narrow top group producing the large majority of cumulative contribution, class B the middle band covering much of what remains, class C everything else. Look at manageability too: the A list should be short enough for a purchasing lead to review item by item every week.
Write the class onto the product record
Running the analysis once and leaving it in a spreadsheet is the most common waste here. The class has to live on the product record as a field or tag — filterable, connected to segments, usable as a condition inside automation rules.
A different policy for every class
Classification on its own earns nothing. The return comes from policies that differ by class, and five levers are worth setting.
- Counting frequency: A items are counted often and in narrow batches, C items rarely and in bulk. Tying your cycle count rhythm to the ABC class is the most practical replacement for the annual wall-to-wall count.
- Safety stock: Running out of an A item is expensive, so safety stock there is a deliberate investment. On C items, generous safety stock freezes working capital on shelves that will never repay it.
- Order frequency and quantity: A items are ordered often in small batches, which lowers tied-up cash. On C items the administrative cost per order exceeds the value of the goods, so buy rarely and in bulk.
- Supplier relationship: If you sit at the negotiating table only a few times a year, set it for A items. Second-source research and lead-time commitments belong there first.
- Slot location: The fastest movers belong at the shortest point of the pick route, heavy slow movers in the far aisles. We cover the payback of ABC-driven slotting in our piece on warehouse and shelf management basics.
XYZ analysis: demand regularity as a second dimension
ABC answers one question: how much money does this item make? A second matters just as much: how predictable is its demand? X items are steady and forecastable. Y items fluctuate with a pattern — a season, a campaign, a project cycle. Z items are irregular.
The distinction earns its keep: manage a high-value item with erratic demand under a classic A policy and you carry excess stock permanently, while babysitting a low-value item with steady demand wastes your time. A working demand forecasting practice is the source that feeds this second dimension.
The nine-box matrix: from AX to CZ
Combine the two dimensions and each of the nine cells asks for a different prescription, closing the biggest blind spot of ABC alone.
AX is the dream cell: high contribution, predictable demand. Trim safety stock and automate the reorder rhythm. AZ is the hardest: items that make real money but whose timing nobody can call. The answer is not more stock, it is more information — hearing about customer projects and planned maintenance early from sales is cheaper than the buffer. CZ is a question about nerve: why are these still in the catalog? Some belong there legitimately; for the rest, liquidation or order-to-supply is better.
In service and technical businesses, spare parts and service inventory management is largely built on handling the AZ and CZ cells correctly.
Seasonality and the new-product exception
ABC looks backward, and two product groups have misleading histories. The first is seasonal items: an analysis run in January drops air conditioners or school backpacks into class C, because even a twelve-month total looks flat off-season. Treat them as a separate cluster and read their class against the season calendar.
The second is new products. An item added three months ago has, by definition, low cumulative contribution and lands in C; apply C policy and it goes out of stock, cannot sell, and fulfills its own prophecy. Give new products a protected class through launch — the cheapest insurance they can get.
How often should the analysis be refreshed?
Assigning classes once and freezing them for years turns ABC into a photograph of the past. In fast-moving goods and fashion, a quarterly refresh is warranted; in industrial goods and spare parts, twice a year or even annually is fine.
Report the class movement, not just the new class. Items climbing from B to A signal rising demand; items sliding from A to B can be the first hint of a lost account. Read that alongside inventory turnover and stock aging analysis to see what is quietly getting old.
Producing ABC from CRM and accounting data
Keeping ABC alive in a standalone spreadsheet costs a manual export every time and leaves the result connected to nothing. If sales transactions, product records and cost data sit in one system, the analysis becomes a recurring report. Because Rocketly keeps product, stock and invoice data together on the accounting side, sales amount and cost come from the same source: rank contribution by product with the custom report builder, write the result back as a tag, and let a scheduled report rebuild it.
As tags, classes connect to workflow automation: open a task for the purchasing lead when an A item drops below threshold, and add a C item to a weekly summary instead. If basic stock discipline is missing, secure inventory management first; ABC is a layer built on top of it.
Wiring classification into pricing and promotion decisions
This is the least used and most profitable extension of ABC. Price sensitivity is high on A items: customers buy them often, know the price by heart and compare it with competitors. An unnecessary discount there damages total margin, while a small improvement drops straight to profit. On C items price awareness is low, and holding the margin rarely dents sales.
On the promotion side: use A items to pull traffic, but keep the discount time-boxed and conditional; move C items inside bundles and kits. If you want price to respond to stock position and demand together, dynamic pricing is the natural continuation. RFM analysis and segmentation separates customers by contribution, ABC separates products; where they intersect, you learn which product to put in front of which customer first.
Common mistakes and how to avoid them
The first is looking at a single dimension. An ABC built on revenue alone inflates thin-margin, high-volume items; one built on movement frequency alone drags cheap consumables into class A. Put at least two measures side by side.
The second is neglecting C items entirely. Class C does not mean "unimportant," it means "managed automatically." Simple reorder rules and infrequent counts are enough — but with no rule at all, C items run out quietly, and when the missing part blocks the sale of an A product, the bill is steep.
The third is freezing the classes: a label assigned once becomes the excuse for wrong decisions as the catalog moves on. The fourth is the sneakiest — producing the classification and attaching it to no policy at all. Then what you hold is not a management tool but a formatted table.
ABC analysis draws the line between trying to keep up with everything and keeping up with the right thing. If you want product, stock, sales and cost data in one place with the classification wired into reports and automations, create your Rocketly account and have your own catalog's A list on the table within the first week.