Spare parts and service inventory management
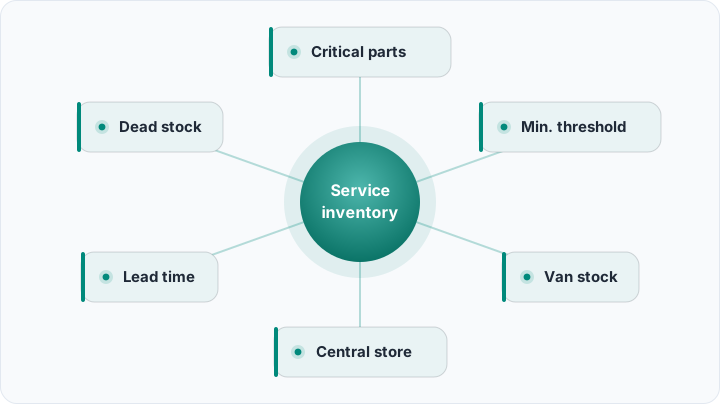
Service inventory follows different rules than retail stock: critical parts lists, lead-time thresholds, van stock, dead stock and the metrics worth watching.
Nine o'clock on a Tuesday. Your technician stands at the customer's production line, panel open, fault obvious: a burned-out control board. Two of those boards sit in the main warehouse, but the system shows zero, because last month's transfer never got recorded. He places a rush order, the customer loses two days of production, and a fortnight later your sales team arrives with a quote for a new machine. It is politely declined. What you lost was not a board — it was the account.
What follows is how those two days get prevented: why service inventory follows a different logic, how to build a critical parts list, how to set thresholds against real lead times, how to split van stock from the central store, and which numbers deserve a dashboard. Service inventory is not a cost line — it is the physical form of the service promise you sold.
Why service inventory is not commercial stock
Commercial stock moves along a curve you can reason about: sales history, seasonality, campaigns. Service inventory is driven by failures, and failures do not consult your forecast. A part sits still for six months, then gets pulled four times in a fortnight; an average consumption figure describes almost nothing about that.
The second difference is variety. A trading business runs a few hundred SKUs; a service team supporting a ten-year installed base carries thousands of part numbers, most moving once a year. The third one hurts: when a retail item is out of stock the customer returns another time, but when a spare part is out of stock the machine stays down. The fundamentals from inventory management still apply; the decision criteria do not.
| Criterion | Commercial stock | Service inventory |
|---|---|---|
| Demand pattern | Reasonably smooth, forecastable | Intermittent, failure-driven, lumpy |
| Item count | Few items, high volume each | Many items, low volume each |
| Cost of a stockout | A delayed or lost sale | A downed machine, a second visit, lost trust |
| Lifespan | A season or a model year | The full service life of the installed base |
| Measure of success | Turnover and margin | Fill rate and parts wait time |
What "we don't have the part" really costs
The visible cost of a stockout is an expedited freight charge. The invisible cost stacks in layers: the technician drives out a second time, scheduled maintenance slips as the crew is pulled onto the emergency, and you pay a premium to make the supplier hurry.
The real bill arrives on the relationship side. Customers accept that machines break; they do not accept being made to wait. A renewal talk that opens with "last time you kept us down three days" ends in a discount. Service inventory belongs to whoever owns after-sales service management end to end, not to the warehouse manager alone.
A spare part's real cost is not incurred while it waits on the shelf. It is incurred while the customer waits.
The critical parts list: failure frequency times customer impact
You cannot stock everything, and you should not try. The first job is to make "critical" a number instead of an opinion, using two axes: how often a part has been consumed across your work orders, and what happens at the customer's site when it is missing.
The first axis comes out of your service history: which part numbers appear over the last twelve months, on which models, against which fault codes. For the second, a three-step scale suffices — parts that stop the machine, parts that degrade performance without stopping it, and cosmetic parts.
How to read the matrix
Frequent, machine-stopping parts get stocked without debate, and some belong in the van. Rare but machine-stopping parts are the hard call, and there the lead time decides. High-frequency, low-impact parts sit centrally in economic quantities; the rest is ordered on demand. This sorting is covered in ABC analysis for inventory prioritization — for service, add that a C-class part can still be mission-critical.
Do not build the list once and file it. As new models ship and old ones leave the field, the list moves with them; twice a year is a sane review rhythm.
Minimum thresholds and the lead time calculation
The logic of a reorder point is plain: how much you will consume between placing an order and receiving it, plus a cushion for things going wrong. Threshold equals average daily consumption times lead time, plus safety stock. The formula is easy; the honesty of the inputs is not.
Take lead time from your own receiving records, not the supplier's brochure — the gap between order date and goods-received date over the past year. Imported parts carry customs and freight variability, so they deserve a bigger cushion. A supplier whose lead time swings forces more stock on you even when the average looks short.
Where the safety cushion belongs
Spreading safety stock evenly across every part number is waste. Weight it toward parts that stop machines, take long to source and move unpredictably; cut it near zero on items your local supplier delivers next morning. The goal is the same capital moved to where the risk sits.
Automatic reorder alerts: teaching the system your thresholds
A threshold that lives in a spreadsheet changes nothing. Value appears when crossing it produces an action by itself: set a minimum quantity per part number in your CRM or bookkeeping module, and open a task for the purchasing owner the moment stock drops below it.
- Give the alert an owner: A notification in a team channel belongs to nobody, while a task assigned to a named person can be chased and its delay is visible.
- Let the alert draft the order: With supplier, part number and suggested quantity attached, the purchasing decision takes minutes instead of days.
- Show what is in transit: An alert that ignores open purchase orders makes you buy the same part twice, so on-order quantity must sit beside on-hand.
- Refresh thresholds periodically: Consumption drifts, and a threshold frozen a year ago either screams constantly or never fires at all.
We walk through the setup in inventory threshold alerts. Because Rocketly builds automation as trigger, condition and action, "stock fell below threshold" wires straight to a task or a notification.
Van stock versus the central warehouse
Any business with a field crew runs several warehouses: one central store and a fleet on wheels. The problem is that van contents appear in no record at all — the technician takes a part, drops it in the van, uses some, forgets the rest, and at month end the count doesn't reconcile.
The fix is simple in concept: make every vehicle its own stock location. A part leaving the store for a van has not been sold, it has been transferred, so "how many do we have" becomes "this many in the store, that many across three vans." Location logic is covered in warehouse and shelf management: WMS basics.
Van contents should not be improvised either. Define a standard list per technician by equipment family and set a weekly rhythm: consumption is recorded during the week, Friday tops the van back up. Without it, vans become personal collections and the company's money sleeps in four trunks.
Tying the part to the work order
Record discipline is won or lost at one point: writing down which job consumed which part, as it happens. A part that leaves stock unattached cannot be costed, and warranty work cannot be told apart from billable work. Keeping work order management and stock movement in one flow is the backbone of a service operation.
The flow: the order opens, planned parts are reserved, the technician marks what was actually fitted, and closing the order creates the stock movement and the invoice line together. Separating reservation from consumption matters — a reserved part must not be claimed by another job.
Barcodes remove the friction
A technician typing part numbers by hand will eventually type the wrong one, and the error surfaces twice: in your stock and on your invoice. Barcoding closes most of that gap — see barcode inventory management for labeling and scanning practice. For crews working from a phone, it is the lowest-friction record keeping there is.
Alternates and equivalent parts
Multi-brand operations end up with several part numbers doing one job: the original manufacturer part, its newer revision, and an aftermarket alternate you trust. Keep them as three unrelated items and your system reports "out of stock" while a usable part sits on the shelf.
The answer is equivalence groups: pick a primary part number, attach acceptable alternates, and calculate thresholds at group level so alternates surface in search. Two cautions — revisions are not always backward compatible, so record which applies to which serial range; and tell the customer when an aftermarket part is used, since quietly making a choice that may affect warranty looks like a saving and ends as a reputation cost.
Dead stock and aging parts
A service store is slow-moving by nature, but slow-moving and never-moving are different animals. Parts for a retired model, leftovers from a canceled project, a custom item over-ordered once — they sit for years, slowing counts and burying the parts that matter.
Build a quarterly aging review: group items by last movement date and decide on anything past your cutoff — return to supplier, transfer to another branch, sell refurbished, or scrap. The method is laid out in inventory turnover and stock aging analysis.
Dead stock has a preventive side too. When a manufacturer announces end of production, the last-time-buy quantity follows from how many units are still in the field and how long you promised to support them. Too generous and you have manufactured dead stock; too cautious and in two years you cannot support a customer. If your installed base lives in your CRM, that call rests on records, not instinct.
Counting discipline and the metrics worth watching
One big annual count is a late diagnosis. Run cycle counts instead: critical parts monthly, the middle group quarterly, the long tail once a year, so drift shows up in weeks. Frequency and practice are covered in our guide on how often to run a cycle count — and do not leave the vans out of scope.
- Fill rate: The share of part requests satisfied from stock the first time they are asked for — the single most telling number here.
- Parts wait time: The gap between a part being requested and reaching the technician's hands — exactly the delay the customer feels.
- First-visit fix rate: The share of work orders closed in a single trip, which nothing degrades faster than a missing part.
- Dead stock share: The weight of items with no movement over your chosen window, against total service inventory value.
Put those four on one dashboard and review them monthly. If fill rate climbs while dead stock share climbs with it, you are buying your way out of the problem; the skill is moving both the right way at once.
Where to start
Do not attempt all of it in a week. Pull the fifty most consumed parts from the last year of work orders, calculate their real lead times, set thresholds and switch the alerts on. Then make every vehicle its own location and launch the part-to-work-order flow. Those two steps alone noticeably reduce how often "we don't have the part" gets said.
If you want service inventory, work orders, invoices and customer history in one place, Rocketly's bookkeeping, automation and reporting modules wire that flow end to end — create your free account and move your critical parts list in this week.